Semihosting is a debugging tool that is built in to most ARM-based microcontrollers. It allows you to use input and output functions on a host computer that get forwarded to your microcontroller over a hardware debugging tool (e.g. ST-LINK). Specifically, it allows you to use printf() debugging to output strings to your IDE’s console while running code on the microcontroller. Note that we’ll be doing this over the Serial Wire Debug (SWD) port.
Before I show you how to enable semihosting with STM32CubeIDE, note that the downside of semihosting is that it is resource intensive and very slow. This post on the Embedded in Rust blog shows how printing a simple sentence over semihosting can take over 100 ms! The upside is every ARM controller should have semihosting available, which can be a lifesaver if that’s all you have.
If you need printf-style debugging (because you can’t or don’t want to do step-through debugging), here are your options on STM32 parts:
- Semihosting: should be built in to every ARM chip, but slow
- Serial (UART): fast, but you need extra pins and hardware (such as a USB to Serial converter board)
- Virtual COM Port (VCP): fast, but you need USB hardware (see my previous post for setting this up)
- Instrumentation Trace Macrocell (ITM): fast output over dedicated SWO pin, but it’s only available on Cortex-M3+ parts (i.e. Cortex-M0 chips don’t have it)
Nucleo
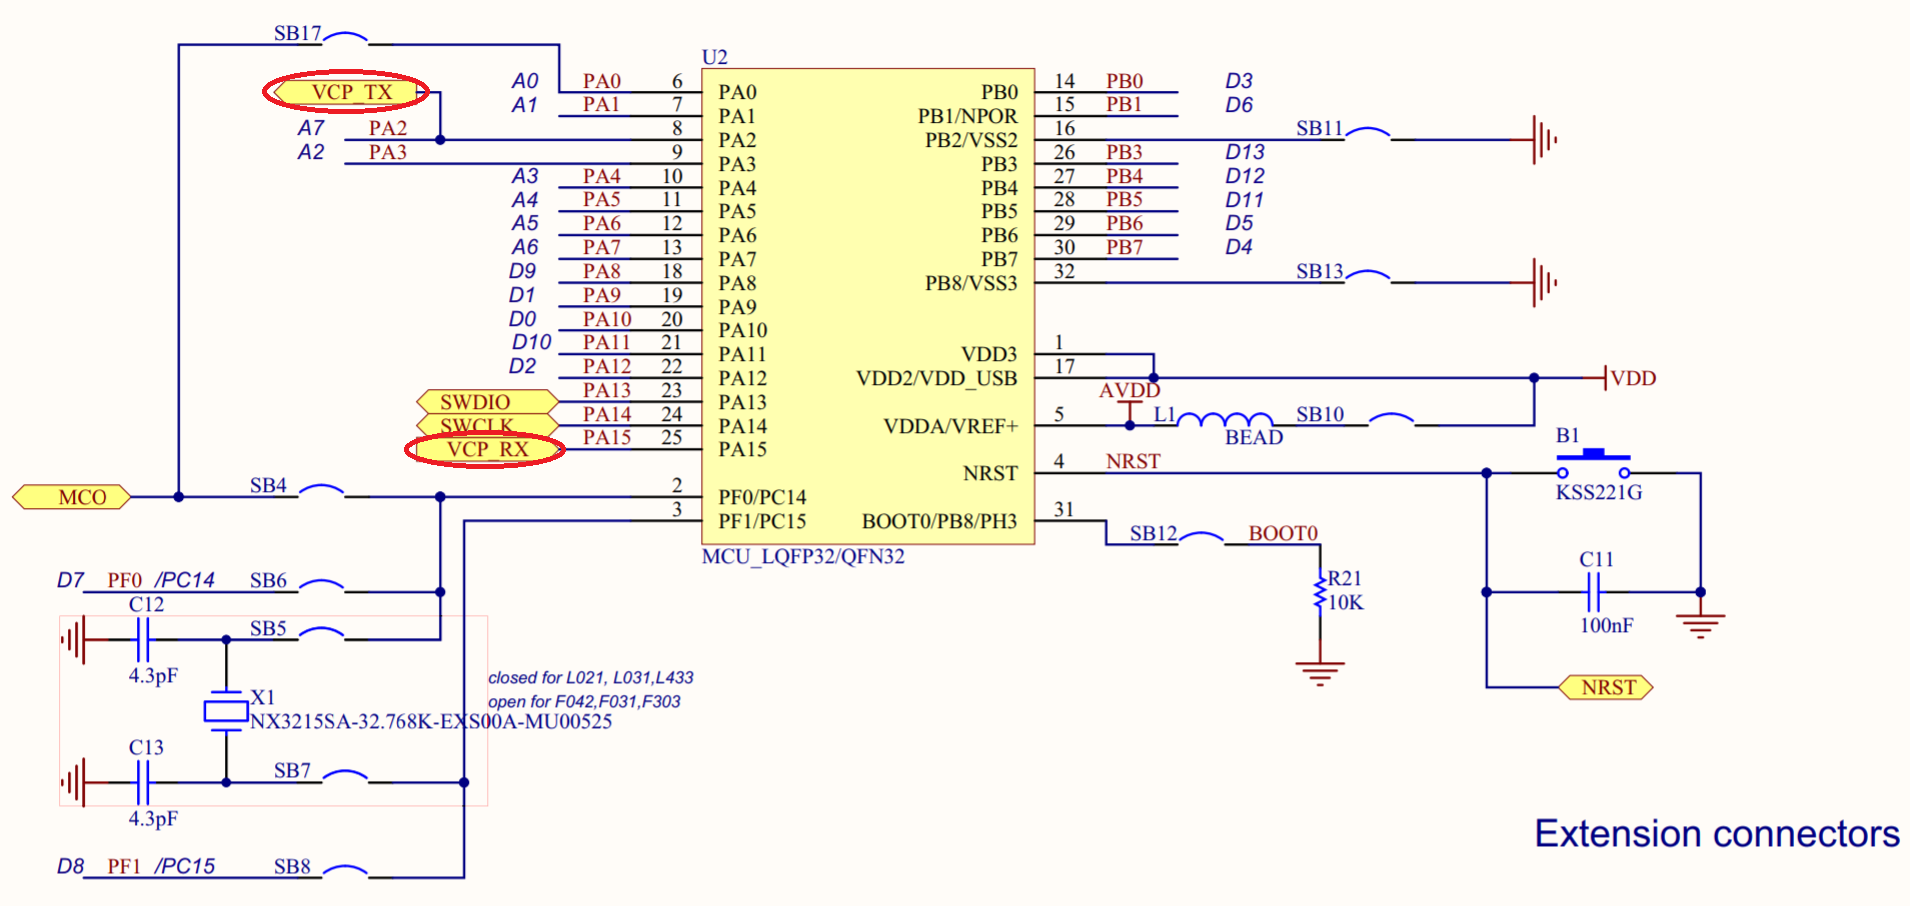
If you are using a Nucleo board, semihosting will work, but I highly recommend using Serial (UART) instead. It’s faster, and every Nucleo board has a built-in Serial to USB converter (it’s part of the ST-LINK chip already on the board). If you look at the schematic of your Nucleo board, you should see TX and RX lines going from the target chip to the ST-LINK chip (circled in red below).
Hardware Hookup
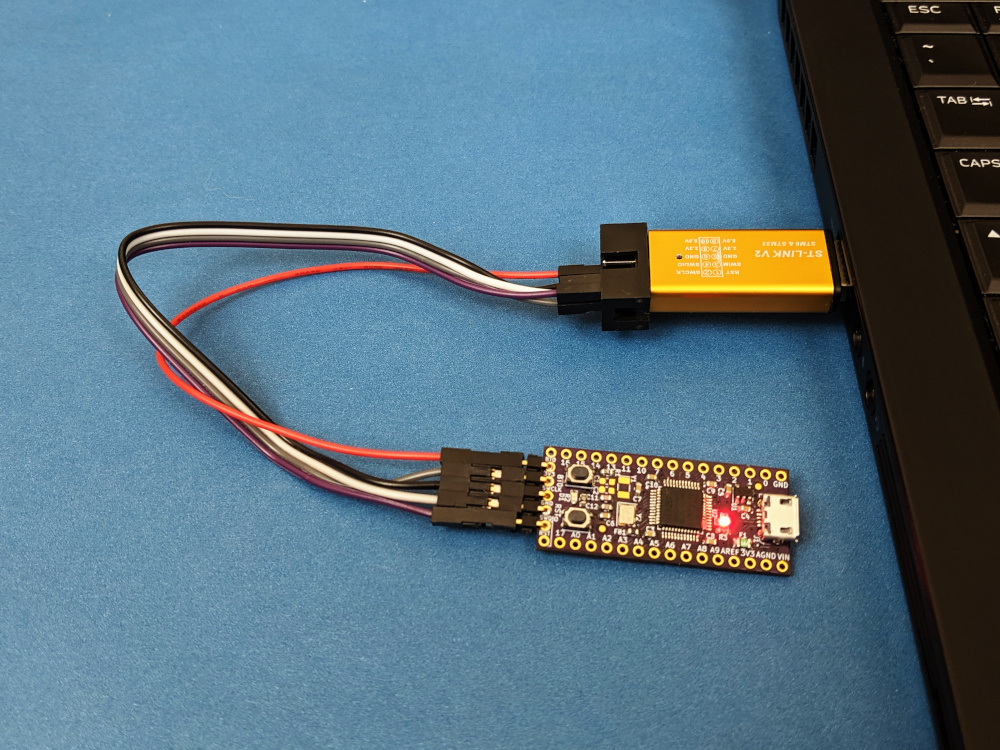
For this demonstration, I’ll be using the STM32F070 Breakout Board that I put together (project files can be found here). You will also need an STMicroelectronics ST-LINK to use as a programmer and debugger:
Connect the following pins from the ST-LINK debugger to your STM32 part:
- 3.3 V
- SWCLK
- GND
- SWDIO
- RST
Plug the ST-LINK into your computer.
CAUTION! Do not plug in the STM32 board (or give it separate power), as we are using the ST-LINK to power our target board. Otherwise, you might damage the target board.
Start a New Project
Create a new project for your STM32 part (select STM32F070CB if you’re using the breakout board I mentioned earlier). You can leave everything in the graphical CubeMX portion as default.
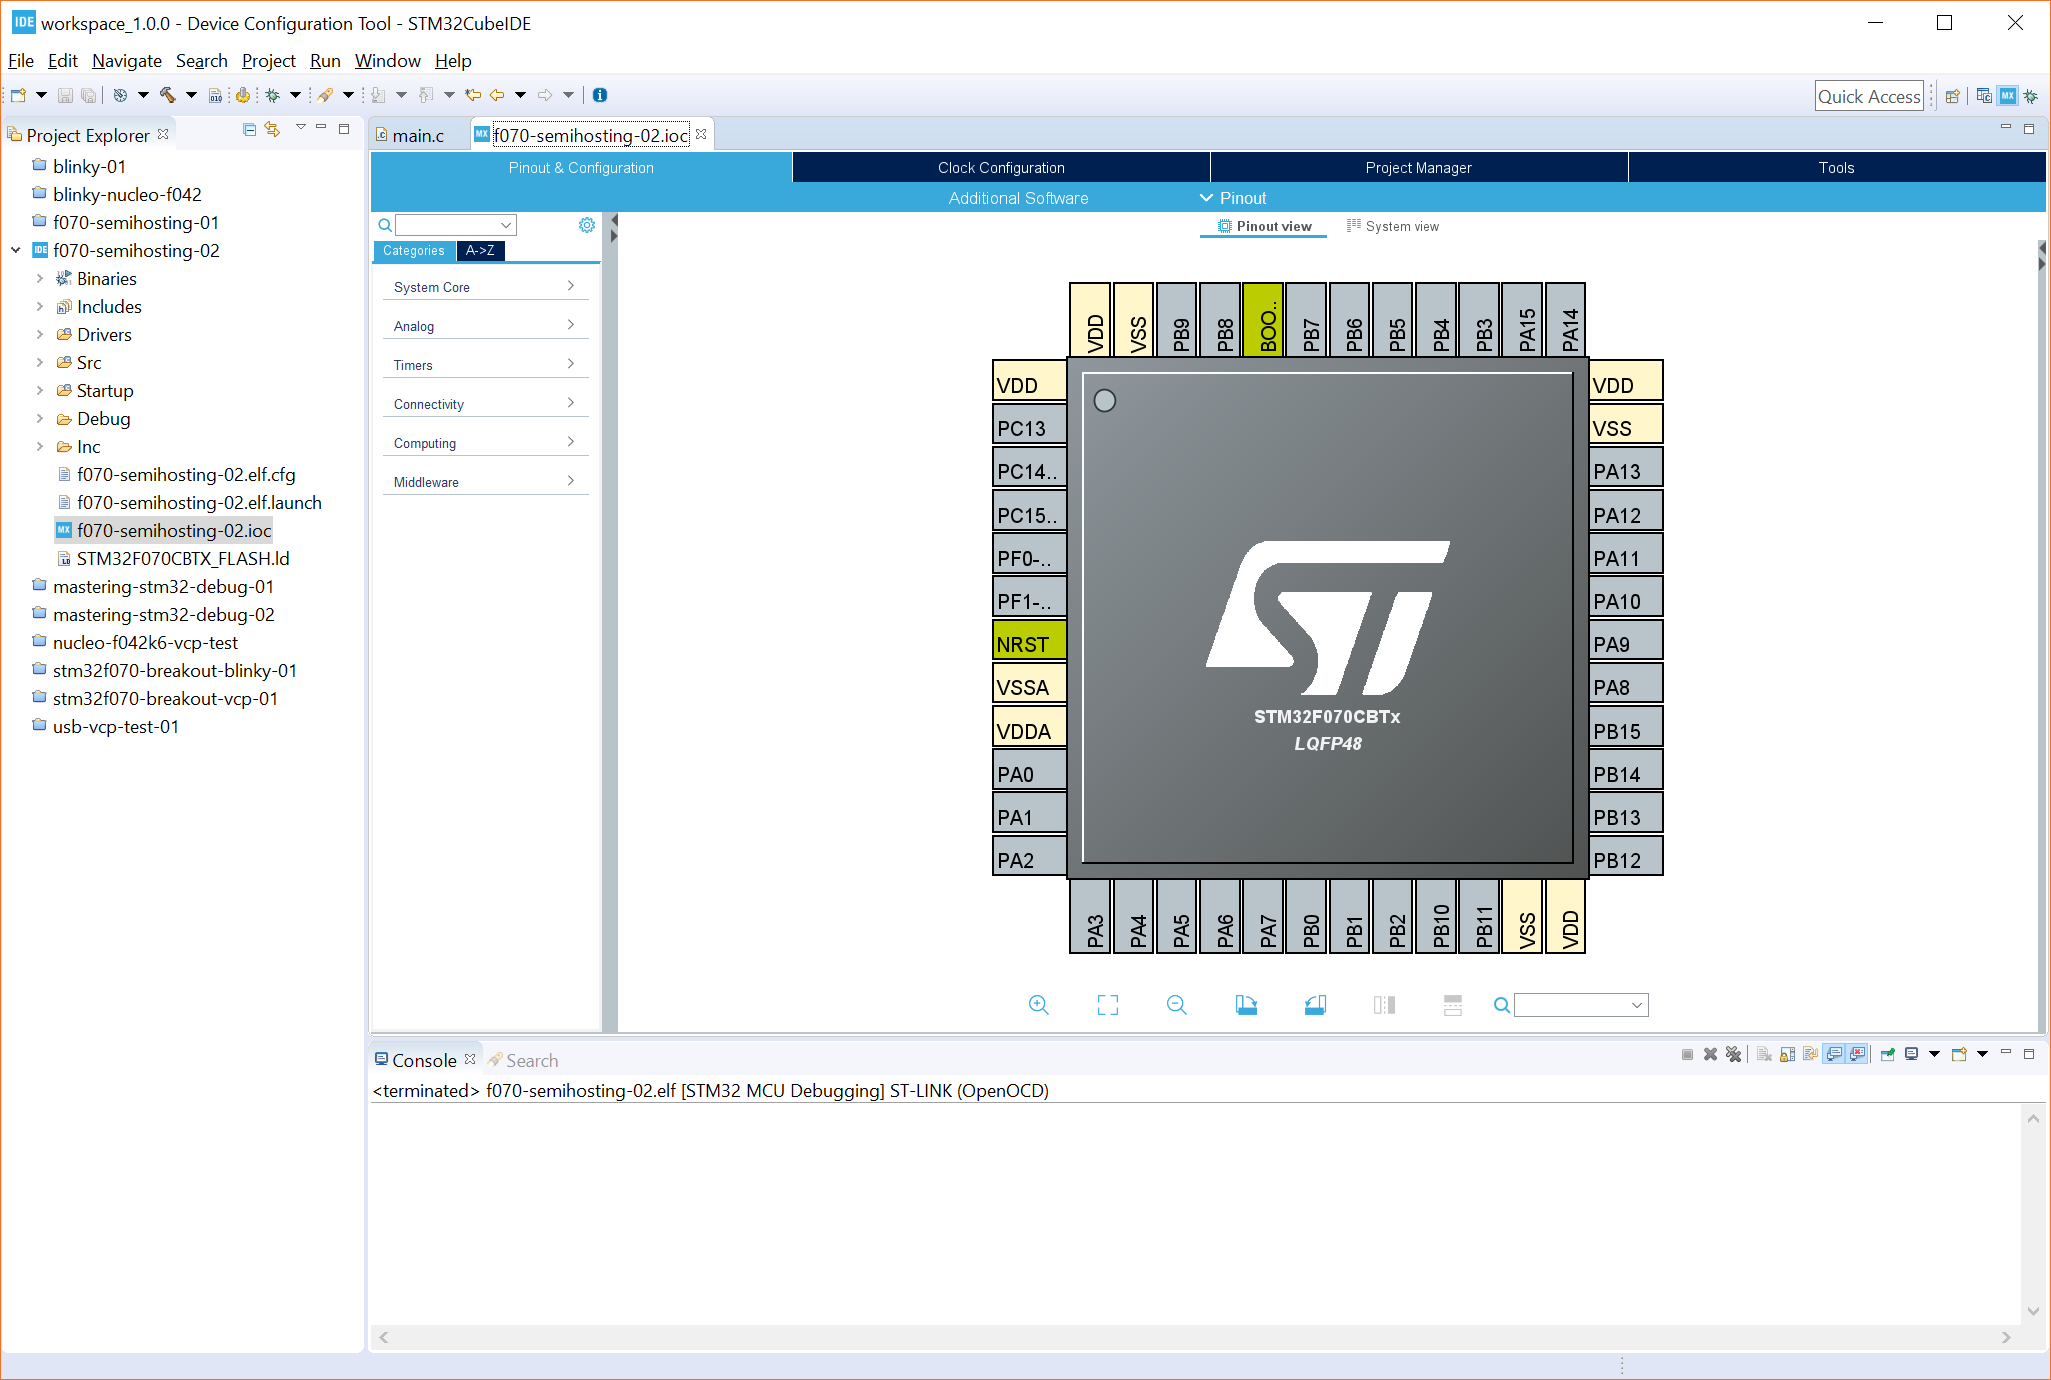
Save and generate code.
Set Linker Parameters
Before writing any code, we need to tell our linker to use the newlib-nano libraries, which houses things like our printf() function. As a result, we also need to tell the linker to ignore the default syscalls.c file. If you forget this step, you will likely end up with several errors like: multiple definition of `_isatty’
To start, go to Project > Properties.
Go in to C/C++ General > Paths and Symbols. Click on the Source Location tab. Click on the arrow next to /<your project>/Src to view the filter. Select Filter (empty) and click the Edit Filter… button. Add syscalls.c to the Exclusion patterns list and click OK.
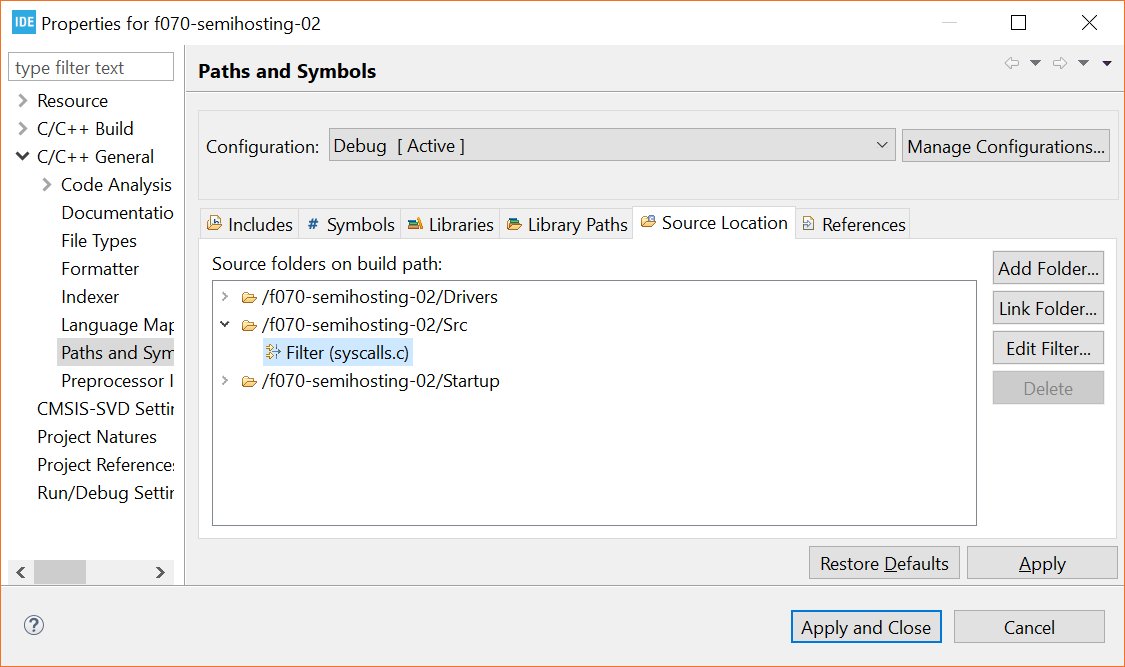
Click Apply.
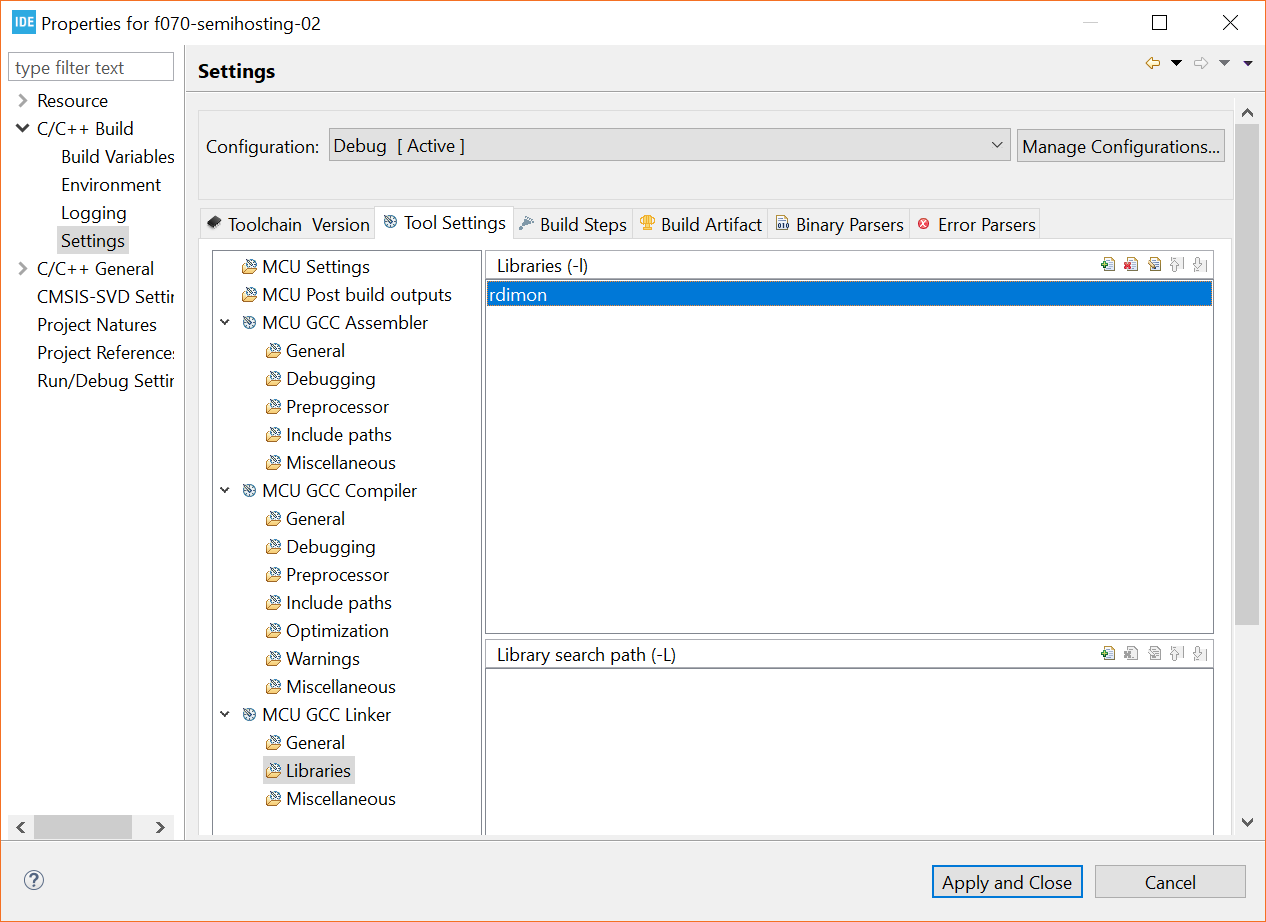
On the left-side pane, go into C/C++ Build and select the Tool Settings tab. Then, select MCU GCC Linker > Libraries. In the libraries pane, click the Add… button and enter rdimon. This enables librdimon for us to make system calls with semihosting.
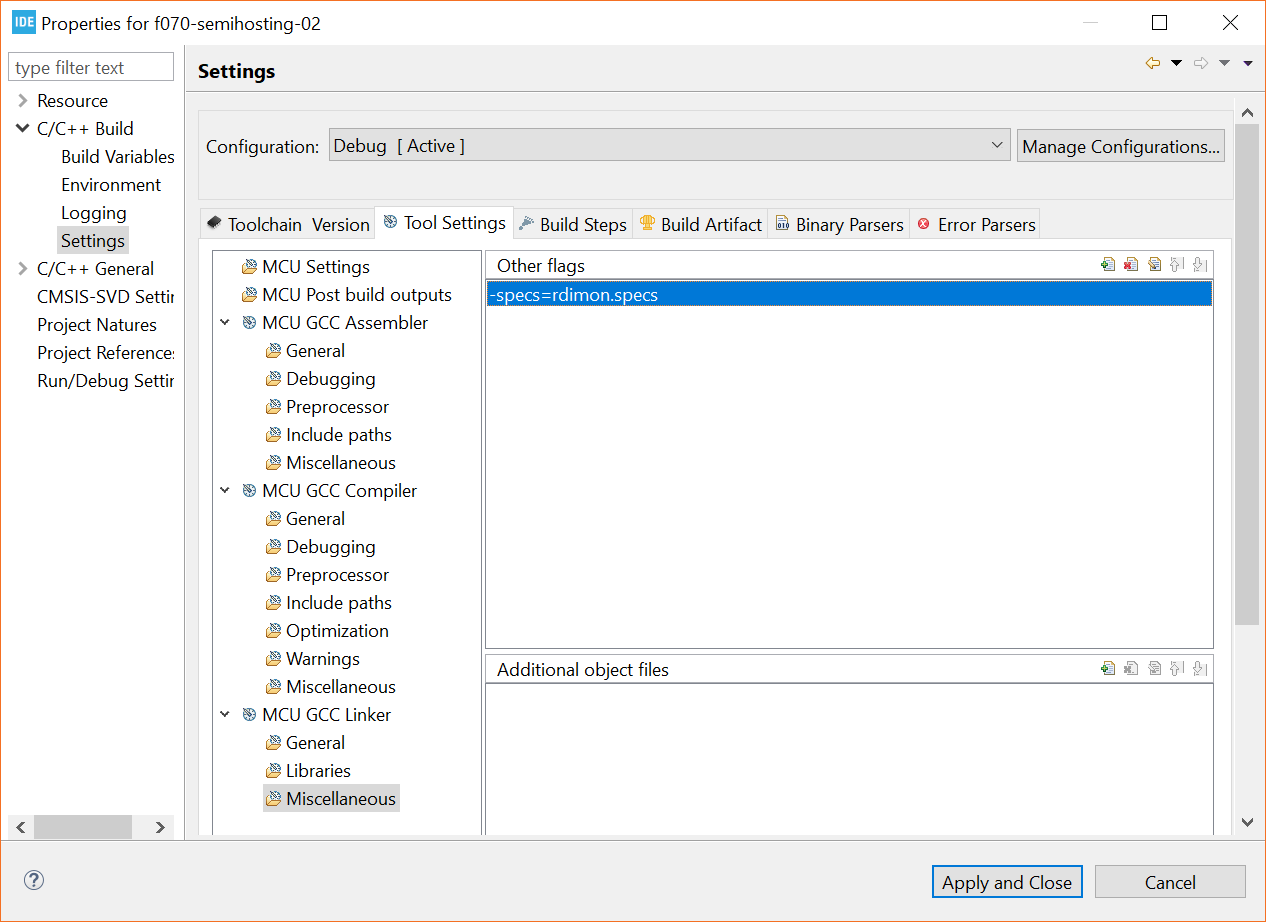
Next, click on MCU GCC Linker > Miscellaneous while still in the Tool Settings tab. Click the Add… button and enter –specs=rdimon.specs into the dialog box.
If you have used another STM32 IDE before and got semihosting to work, you probably needed to specify nano.specs and nosys.specs in the linker options. If you take a look at MCU Settings and MCU GCC Linker > General (within the Tool Settings tab), you will see that both of these have been set by default in STM32CubeIDE.
Click Apply and Close.
Add printf Code
Open Src/main.c. Above int main(void) , add the following line (I put mine in the USER CODE 0 section):
extern void initialise_monitor_handles(void);
In int main(void) (before the while(1) loop), add the following line (I put mine in the USER CODE 1 section):
initialise_monitor_handles();
This configures the semihosting system calls for us.
Finally, inside the while(1) loop, add the following:
printf("Hello, World!\n");
HAL_Delay(1000);
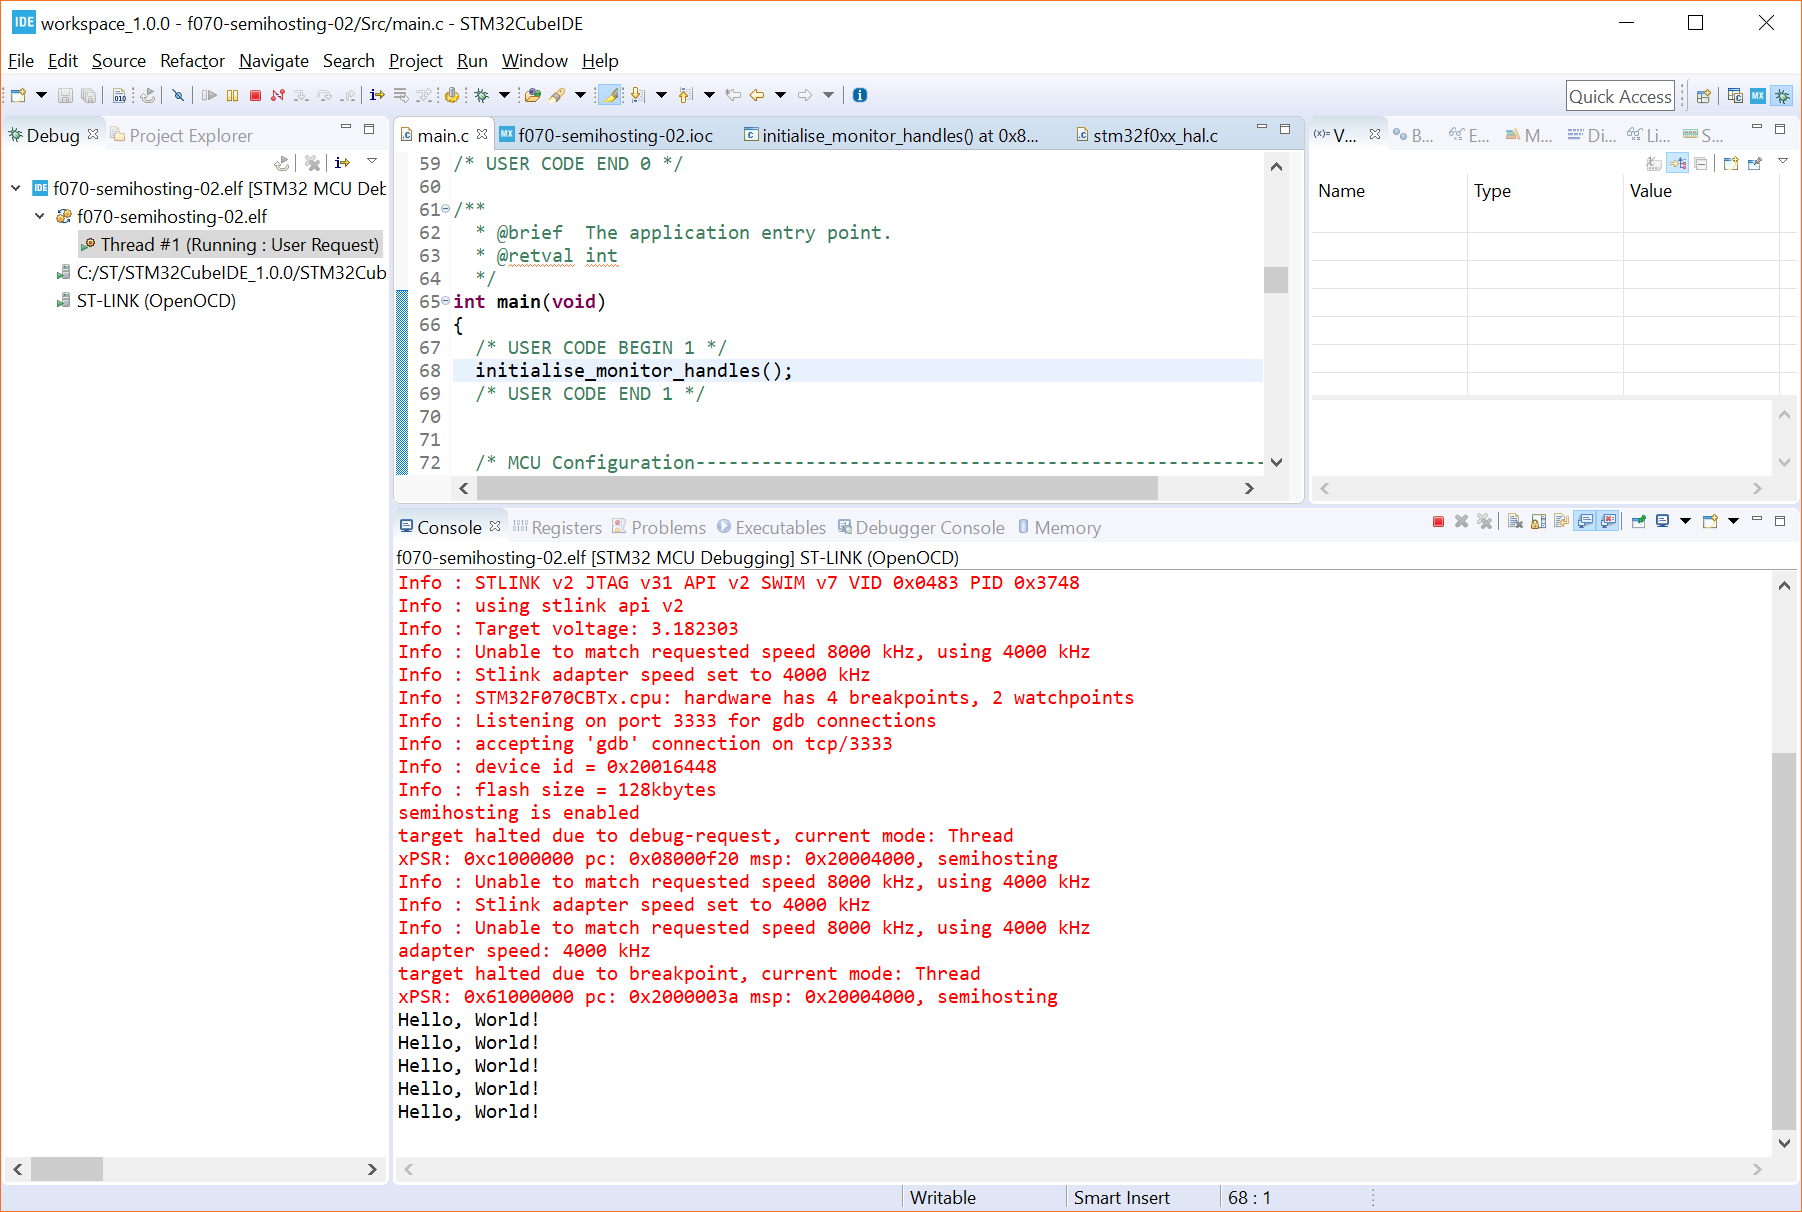
To summarize, here is the section of code from main.c that you need to worry about:
/* Private user code ---------------------------------------------------------*/
/* USER CODE BEGIN 0 */
extern void initialise_monitor_handles(void);
/* USER CODE END 0 */

/**
* @brief The application entry point.
* @retval int
*/
int main(void)
{
/* USER CODE BEGIN 1 */
initialise_monitor_handles();
/* USER CODE END 1 */

/* MCU Configuration--------------------------------------------------------*/

/* Reset of all peripherals, Initializes the Flash interface and the Systick. */
HAL_Init();

/* USER CODE BEGIN Init */

/* USER CODE END Init */

/* Configure the system clock */
SystemClock_Config();

/* USER CODE BEGIN SysInit */

/* USER CODE END SysInit */

/* Initialize all configured peripherals */
/* USER CODE BEGIN 2 */

/* USER CODE END 2 */

/* Infinite loop */
/* USER CODE BEGIN WHILE */
while (1)
{
/* USER CODE END WHILE */

/* USER CODE BEGIN 3 */
printf("Hello, World!\n");
HAL_Delay(1000);
}
/* USER CODE END 3 */
}
Click Project > Build Project to compile and link everything.
Set Debug Configuration
Select Run > Debug As > STM32 MCU C/C++ Application. You should get a pop-up window asking you to “edit launch configuration properties.” If you have already done this once before, you will not get the launch configuration window. To get it, click on Run > Debug Configurations and select <your project>.elf under STM32 MCU Debugging.
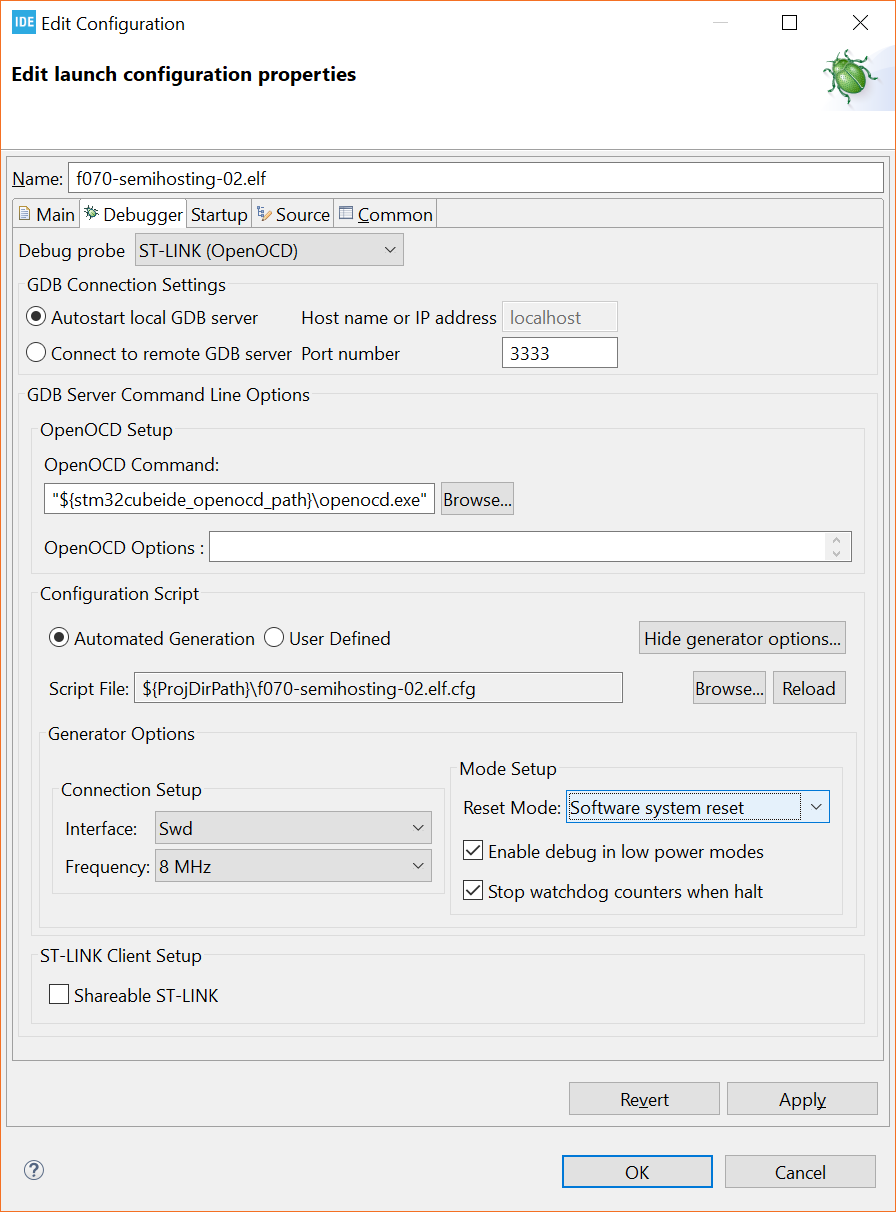
Click on the Debugger tab. Change the Debug probe to ST-LINK (OpenOCD).
If you are using an official ST-LINK, you should be good to go. However, note that RST pin of the knockoff ST-LINK boards (such as the ST-LINK/V2 I listed above) may not work. As a result, you will need to use the software reset option when GDB starts.
To enable software reset, click Show generator options… in the Debugger tab (while still in the Debug Configurations window). Under Mode Setup, change Reset Mode to Software system reset.
Go to the Startup tab and enter the following command: monitor arm semihosting enable
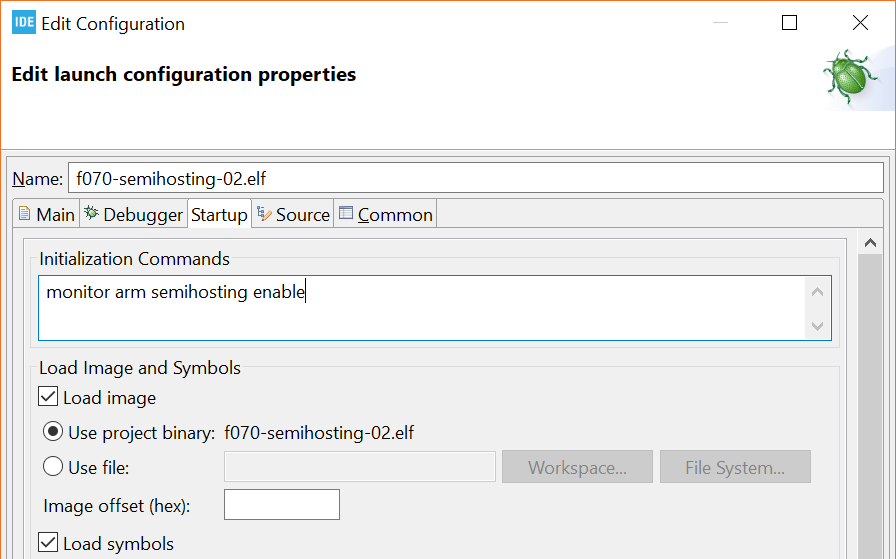
This tells the GDB session to allow for semihosting. Click OK, and switch to the debugging perspective when asked.
Run It
In the debugging perspective, click Run > Resume, and you should see “Hello, World!” being printed at the bottom of the console once per second.
Semihosting can help you with your debugging efforts, should you need some kind of console output. Note that other standard commands, like scanf, should work (I have not tested it yet).
Hi Shawn, I’m trying to follow this tutorial but I get an “arm-none-eabi-gcc: error: specs=rdimon.specs: No such file or directory” error when I try to compile. I am on Linux Mint 18.2, STM32CubeIDE and a STM32F4-Discovery board. Am I missing a library or sth? Do you know how to fix it? I was searching online but I barely understand what people say about compilers, libraries and so on.
I saw your first video about STM32 and Nucleo in the DigiKey YouTube channel and it’s great! Thank you for all the stuff you share!
Sounds like the IDE can’t find newlib on your Linux machine. I haven’t tried it on Linux, so I can’t verify. However, it seems to be somewhat common: https://stackoverflow.com/questions/41662366/issue-with-compling-arm-assembly-code. So, you might try:
sudo apt install libnewlib-arm-none-eabi
to see if that works.
I think you’re missing the “–” at the begining of “–specs=rdimon.specs”
Good catch, thanks!
tested with my discovery board on windows machine, works very well
thanks
Glad to hear it worked!
Hi Shawn,
I am trying to follow this tutorial on semihosting with NUCLEO-F072 board but debug kick out at the same step every time I attempt to launch a session. Can you point me where to look for the problem please (Win10, STM32cubeIDE v1.3). I did change the port 3333 to 6666 as the debug kicks out early with “Error: couldn’t bind tcl to socket on port 6666: No error”..
The Console output is:
Open On-Chip Debugger 0.10.0+dev-01193-g5ce997d (2020-02-20-10:57)
Licensed under GNU GPL v2
For bug reports, read
http://openocd.org/doc/doxygen/bugs.html
none separate
Info : The selected transport took over low-level target control. The results might differ compared to plain JTAG/SWD
adapter speed: 4000 kHz
adapter_nsrst_delay: 100
Info : Listening on port 9999 for tcl connections
Info : Listening on port 7777 for telnet connections
Info : clock speed 4000 kHz
Info : STLINK V2J36S26 (API v2) VID:PID 0483:374B
Info : using stlink api v2
Info : Target voltage: 3.262549
Info : SRST line released
Info : STM32F072RBTx.cpu: hardware has 4 breakpoints, 2 watchpoints
Error: couldn’t bind gdb to socket on port 6666: No error
Ok, I tried another port number (1234) and the debug session went through as expected.. Thank you for this tutorial Shawn!
Glad it helped, and thanks for posting what you found! I hope it might help others on Windows.
can anyone help me with this error pleas ?
GNU MCU Eclipse 64-bits Open On-Chip Debugger 0.10.0+dev-00404-g20463c28 (2018-01-23-12:30)
Licensed under GNU GPL v2
For bug reports, read
http://openocd.org/doc/doxygen/bugs.html
WARNING: interface/stlink-v2.cfg is deprecated, please switch to interface/stlink.cfg
Info : auto-selecting first available session transport “hla_swd”. To override use ‘transport select ‘.
Info : The selected transport took over low-level target control. The results might differ compared to plain JTAG/SWD
adapter speed: 1000 kHz
adapter_nsrst_delay: 100
none separate
Started by GNU ARM Eclipse
Error: couldn’t bind tcl to socket on port 6666: No error
Hi Shawn,
ii did and everything works. great. But I was wondering, since I have more than one emulator … with ST-Link it works, but with Jlink from Segger I couldn’t get it to work. It can be done ?
I don’t have a J-Link, so I can’t test it. In the Debug Configurations, there is an option to select the Segger J-Link as the “Debug Probe.” I recommend starting there and trying different settings in that Debug Configuration window.
If you have one of the ST dev boards, you can re-flash the ST-LINK as a J-Link using a utility from Segger https://www.segger.com/products/debug-probes/j-link/models/other-j-links/st-link-on-board/ (this is reversible in case you want to go back to the ST-LINK firmware)
I was able to get semihosting to work with this J-Link firmware running on the ST-LINK hardware.
1. Under “Debug Configuration” -> “Debugger” make sure “Debug Probe” is set to “SEGGER J-Link”.
2. Under “Debug Configuration” -> “Startup” make sure “Initialization Commands” is set to “monitor semihosting enable”.
By default, GDBServer will output semihosting terminal data from the target via a separate connection on port 2333.
As a result, you won’t see the semihosting output in the Eclipse console. Instead, you have to launch an external TELNET session and connect to “localhost:2333” to see the output.
GDB itself can handle (file) I/O operations, and it’s possible to print output via TELNET port (2333), GDB, or both by adding the initialization command “semihosting IOClient ” where is:
– 1 for TELNET Client (Standard port 2333) (Default)
– 2 for GDB Client
– or 3 for both (Input via GDB Client)
However, I don’t think STM32CubeIDE supports ClientMask 2 or 3 (I wasn’t able to get the output to show up inside the eclipse console with either of these options).
It looks like the some of the text in angle brackets wasn’t shown in my previous comment above. It should read:
“GDB itself can handle (file) I/O operations, and it’s possible to print output via TELNET port (2333), GDB, or both by adding the initialization command “semihosting IOClient [ClientMask]” where ClientMask is:”
More details in https://www.segger.com/downloads/jlink/UM08001
If you are using the JLink debugger (host), use “monitor semihosting enable” as opposed to (monitor *arm* semihosting enable)
Hi Shawn, thanks for the demo! I am having a problem occur: “Error in final launch sequence: failed to execute MI command: monitor arm semihosting enable” I am wondering if you have any thoughts on the nature of this issue? I am using Nucleo L432 CubeIDE on Ubuntu. Thanks!
I am not familiar with that error. Maybe the STM32 forum would be able to help: https://community.st.com/s/question/0D50X0000BL8nc2/failed-to-execute-mi-command
Hi, Shawn:
This guide works great, thank you very much! However, I haven’t been able to verify this:
“If you have used another STM32 IDE before and got semihosting to work, you probably needed to specify nano.specs and nosys.specs in the linker options. If you take a look at MCU Settings and MCU GCC Linker > General (within the Tool Settings tab), you will see that both of these have been set by default in STM32CubeIDE.”
In the “General” tab of “MCU GCC Linker” (in STM32CubeIDE v1.4.2) I cannot find “nano.specs” or “nosys.specs” anywhere. I don’t know if they are essential because it worked just fine, but maybe they’ll give problems in the future.
Thank you very much,
Nick.
I little inside of my experience, you need to add the terminator “\n” in order to see the message
Thank for you.. Your tutorial guide is very helpful. I’ve meet the problem. The console only display to limit 4 printf. I don’t know why . Could you help.
Info : Listening on port 6666 for tcl connections
Info : Listening on port 4444 for telnet connections
Info : STLINK V2J37S7 (API v2) VID:PID 0483:3748
Info : Target voltage: 3.236508
Info : Unable to match requested speed 8000 kHz, using 4000 kHz
Info : Unable to match requested speed 8000 kHz, using 4000 kHz
Info : clock speed 4000 kHz
Info : stlink_dap_op_connect(connect)
Info : SWD DPIDR 0x2ba01477
Info : STM32F407VETx.cpu: hardware has 6 breakpoints, 4 watchpoints
Info : starting gdb server for STM32F407VETx.cpu on 3333
Info : Listening on port 3333 for gdb connections
Info : accepting ‘gdb’ connection on tcp/3333
Info : device id = 0x10076413
Info : flash size = 512 kbytes
undefined debug reason 8 – target needs reset
target halted due to debug-request, current mode: Thread
xPSR: 0x01000000 pc: 0x080007cc msp: 0x20020000
configuring PLL
Info : Unable to match requested speed 8000 kHz, using 4000 kHz
Info : Unable to match requested speed 8000 kHz, using 4000 kHz
Info : Padding image section 0 at 0x08000188 with 8 bytes
target halted due to debug-request, current mode: Thread
xPSR: 0x01000000 pc: 0x080007e8 msp: 0x20020000
semihosting is enabled
Welcome to Demo Task 0
Welcome to Demo Task 1
Welcome to Demo Task 2
Welcome to Demo Task 3
“target halted due to debug-request” I’m guessing that something is stopping the program somewhere. I recommend using the debugger to track it down.
Hi,
I am using the STM32CubeIDE with the Nucleo-L476RG (using this bord for a work project so I cant use anything else) and I get this error message:
arm-none-eabi-gcc: error: specs=rdimon.specs: No such file or directory
make: *** [makefile:44: semihosting printf.elf] Error 1
Can someone help me with this problem?
@Tim Huprich
Looks like you have “specs=rdimon.specs” for your linker argument. Try adding a ‘-‘ (dash) at the beginning, ala “-specs=rdimon.specs”. Also, please see first few comments above for similar issue.
In my STM32CubeIDE environment, only using “–specs=rdimon.specs” can work, a single dash ‘-‘ will not work.
and Alvaro’s comment is right, only when “\n” termination is added in the print content, the string can display in the console.
Hi Shawn,
Thanks a lot for your great instructions, I am always impressed and helped further in a process.
I would like to point out that to make this work on my board (STM32L152C-discovery (RCT6) I had to include #include to recognise the printf function. Maybe reading this will help someone else out 🙂
Thanks a lot for the instructions!
Kind regards,
Tomislav Hooij
Glad it helped!
Hi Shawn,
I am a newbie o STM32 and learning the ropes , I have a STM32F4 discovery kit with STLINK , the printf doesn’t print anything on SWV console , its a clean build , the downloads successfully , run without error in debug , but prints nothing on ITM data console. Please help resolve this – Thanks
Just wanted to say thanks so much — this is an amazing tutorial! I stumbled upon stm32 semihosting on stackoverflow, while I was dreading setting up UARTs for printf. I found this article and you made it easy.
This was super straight forward to follow and worked perfectly on Linux! The only change was the filter is now “Src/syscalls.c” uder the /ProjectName/Core.
Really appreciate the article and hope you keep posting great ones like this!
This works on Linux (DebianV10) with my stm32f4-discovery and stm32F407vgt6 with just the USB mini (not micro) connection. My question is why won’t the SWV ITM data console work instead? Is the function just not available with this board or are extra connections necessary to make the SWV work? I thought I had tried everything but needed to revert to semihosting instead.
I haven’t tried the SWV yet, so I’m not sure. Have you tried the steps in this article? http://www.embedded-communication.com/en/misc/english-printf-using-st-link-debug-interface-swd-itm-view/
Hello,
Thanks for in-depth tutorial. Actually, I will have an STm32 project later this year so this helps. But right now I’m working on the cyclone V Soc development kit and trying to compile freertRTOS on ARM Cortex A9, and getting some errors from the assembler that may be due to not enabling semihosting. I think there is a special trick to enable semihosting on this processor toolchain. Something like defining a global variable – correct me if I’m wrong:
int _semihosting;
Do you happen to know about this, or how does it relate to the debugger setup you described?
Thank you
Sorry, I don’t know anything about the Cyclone/Altera/Intel development environment. Your best bet would probably be to ask on the Intel forums (https://community.intel.com/) to see if anyone there knows.
Hi I have tried this on STM32CubeIDE Version: 1.12.0 running mac os 13.3.1 and I receive the error:
arm-none-eabi-gcc: error: specs=rdimon.specs: No such file or directory
Do I need to install another library for this to work?
Hi Shawn,thank you very much for such a detailed article, almost every step was performed without much effort. However, in the end there was such a problem:
Open On-Chip Debugger 0.12.0-00017-gb153daa14 (2023-02-03-14:58) [https://github.com/STMicroelectronics/OpenOCD]
Licensed under GNU GPL v2
For bug reports, read
http://openocd.org/doc/doxygen/bugs.html
Info : Listening on port 6666 for tcl connections
Info : Listening on port 4444 for telnet connections
Info : STLINK V2J41S7 (API v2) VID:PID 0483:3748
Info : Target voltage: 3.099551
Info : Unable to match requested speed 8000 kHz, using 4000 kHz
Info : Unable to match requested speed 8000 kHz, using 4000 kHz
Info : clock speed 4000 kHz
Info : stlink_dap_op_connect(connect)
Info : SWD DPIDR 0x1ba01477
Info : [STM32F103C8Tx.cpu] Cortex-M3 r1p1 processor detected
Info : [STM32F103C8Tx.cpu] target has 6 breakpoints, 4 watchpoints
Info : starting gdb server for STM32F103C8Tx.cpu on 3333
Info : Listening on port 3333 for gdb connections
Info : accepting ‘gdb’ connection on tcp/3333
Info : device id = 0x20036410
Info : flash size = 64 KiB
Warn : GDB connection 1 on target STM32F103C8Tx.cpu not halted
undefined debug reason 8 – target needs reset
Info : accepting ‘gdb’ connection on tcp/3333
Warn : GDB connection 2 on target STM32F103C8Tx.cpu not halted
undefined debug reason 8 – target needs reset
Error: Failed to write memory at 0x08010584
Error: Failed to write memory at 0x08010588
Info : dropped ‘gdb’ connection
shutdown command invoked
Info : dropped ‘gdb’ connection
I use STM32F103C8 blue pill in STM32CubeIDE 1.12.1(Win10x64)
Thank you very much, Shawn!
In the mode ST-LINK GDB server I have everything goes without problems, but in the mode OPenOCD I get this error:
Open On-Chip Debugger 0.12.0-00017-gb153daa14 (2023-02-03-14:58) [https://github.com/STMicroelectronics/OpenOCD]
Licensed under GNU GPL v2
For bug reports, read
http://openocd.org/doc/doxygen/bugs.html
Info : Listening on port 6666 for tcl connections
Info : Listening on port 4444 for telnet connections
Info : STLINK V2J41S7 (API v2) VID:PID 0483:3748
Info : Target voltage: 3.102627
Info : clock speed 4000 kHz
Info : stlink_dap_op_connect(connect)
Info : SWD DPIDR 0x1ba01477
Info : [STM32F103C8Tx.cpu] Cortex-M3 r1p1 processor detected
Info : [STM32F103C8Tx.cpu] target has 6 breakpoints, 4 watchpoints
Info : starting gdb server for STM32F103C8Tx.cpu on 3333
Info : Listening on port 3333 for gdb connections
Info : accepting ‘gdb’ connection on tcp/3333
Info : device id = 0x20036410
Info : flash size = 64 KiB
Warn : GDB connection 1 on target STM32F103C8Tx.cpu not halted
undefined debug reason 8 – target needs reset
Info : accepting ‘gdb’ connection on tcp/3333
Warn : GDB connection 2 on target STM32F103C8Tx.cpu not halted
undefined debug reason 8 – target needs reset
Error: Failed to write memory at 0x08010584
Error: Failed to write memory at 0x08010588
Info : dropped ‘gdb’ connection
shutdown command invoked
Info : dropped ‘gdb’ connection
Reset Mode: Software system reset.
I have tried other modes(Reset Mode) and frequencies(change Connecction Setup), so far nothing has helped. Tell me where the problem is.
Thanks for this tutorial,
it worked for me with my jLink and the changes from the comments.
And i was able to open a command shell console inside stm32CubeIde 1.6.0 to open a telnet connection
to localhost on port 2333
Hi Shawn, thanks. I originally already set up my project using CubeMX , but I’ve done a lot of work on it since then and didn’t want to revisit. However, you gave me the clue I needed to eliminate annoying stops on BKPT #0xAB. For now I have eliminated all printf calls until I’m ready to use them.
Glad it helped!