Semihosting is a debugging tool that is built in to most ARM-based microcontrollers. It allows you to use input and output functions on a host computer that get forwarded to your microcontroller over a hardware debugging tool (e.g. ST-LINK). Specifically, it allows you to use printf() debugging to output strings to your IDE’s console while running code on the microcontroller. Note that we’ll be doing this over the Serial Wire Debug (SWD) port.
Before I show you how to enable semihosting with STM32CubeIDE, note that the downside of semihosting is that it is resource intensive and very slow. This post on the Embedded in Rust blog shows how printing a simple sentence over semihosting can take over 100 ms! The upside is every ARM controller should have semihosting available, which can be a lifesaver if that’s all you have.
If you need printf-style debugging (because you can’t or don’t want to do step-through debugging), here are your options on STM32 parts:
- Semihosting: should be built in to every ARM chip, but slow
- Serial (UART): fast, but you need extra pins and hardware (such as a USB to Serial converter board)
- Virtual COM Port (VCP): fast, but you need USB hardware (see my previous post for setting this up)
- Instrumentation Trace Macrocell (ITM): fast output over dedicated SWO pin, but it’s only available on Cortex-M3+ parts (i.e. Cortex-M0 chips don’t have it)
Nucleo
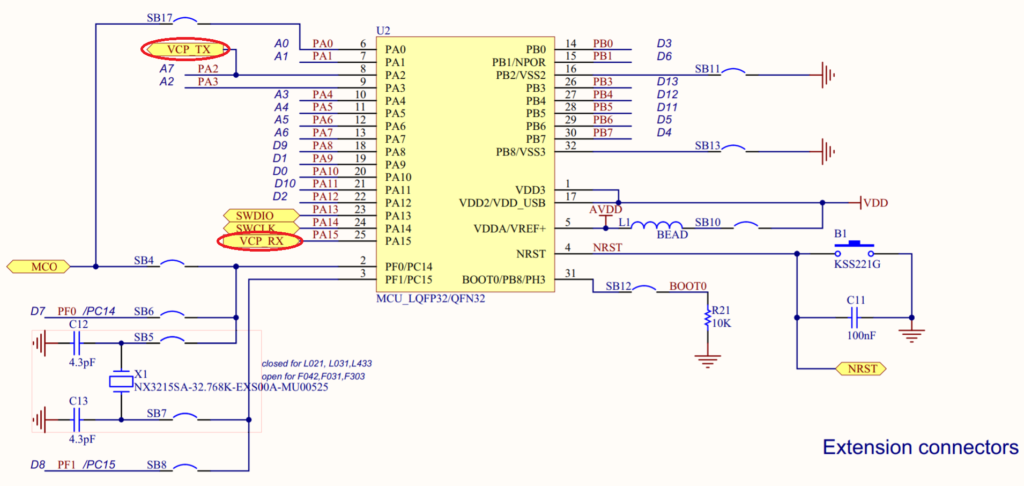
If you are using a Nucleo board, semihosting will work, but I highly recommend using Serial (UART) instead. It’s faster, and every Nucleo board has a built-in Serial to USB converter (it’s part of the ST-LINK chip already on the board). If you look at the schematic of your Nucleo board, you should see TX and RX lines going from the target chip to the ST-LINK chip (circled in red below).
Hardware Hookup
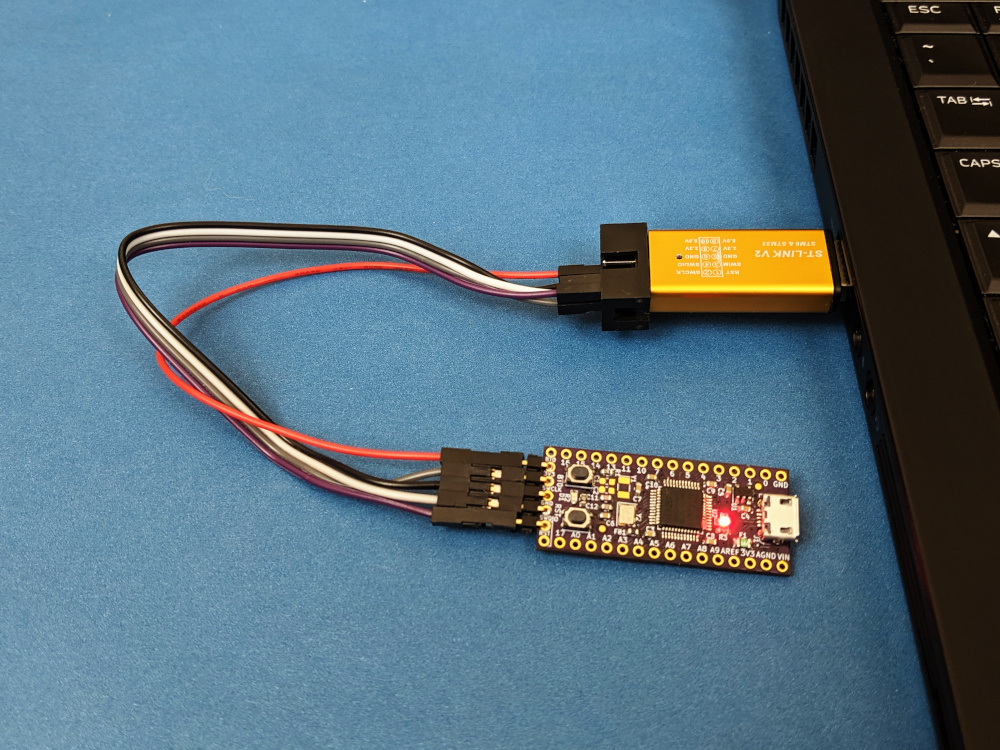
For this demonstration, I’ll be using the STM32F070 Breakout Board that I put together (project files can be found here). You will also need an STMicroelectronics ST-LINK to use as a programmer and debugger:
Connect the following pins from the ST-LINK debugger to your STM32 part:
- 3.3 V
- SWCLK
- GND
- SWDIO
- RST
Plug the ST-LINK into your computer.
CAUTION! Do not plug in the STM32 board (or give it separate power), as we are using the ST-LINK to power our target board. Otherwise, you might damage the target board.
Start a New Project
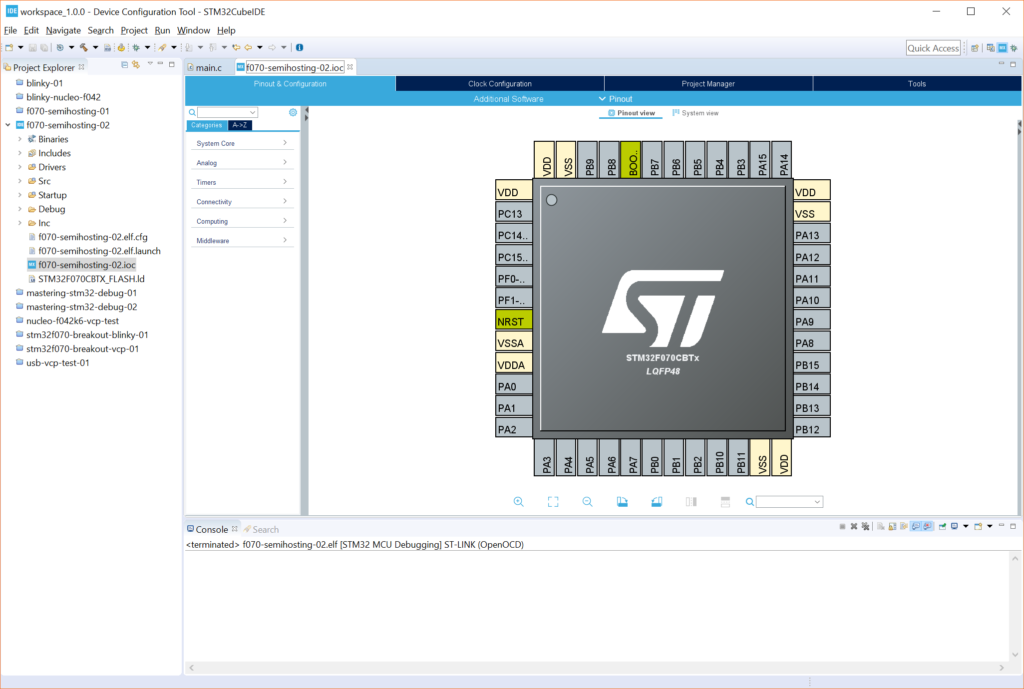
Create a new project for your STM32 part (select STM32F070CB if you’re using the breakout board I mentioned earlier). You can leave everything in the graphical CubeMX portion as default.
Save and generate code.
Set Linker Parameters
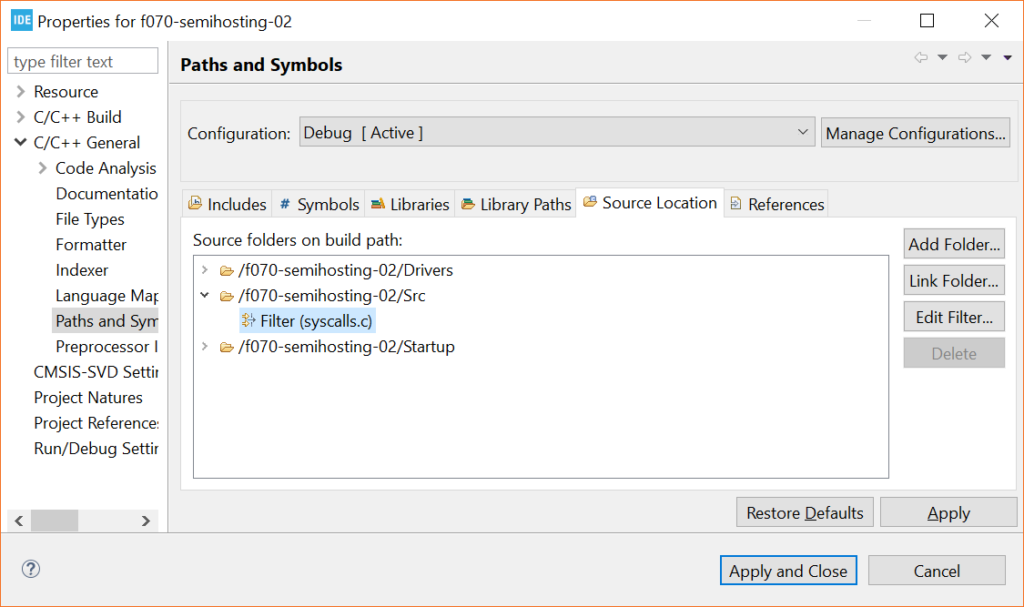
Before writing any code, we need to tell our linker to use the newlib-nano libraries, which houses things like our printf() function. As a result, we also need to tell the linker to ignore the default syscalls.c file. If you forget this step, you will likely end up with several errors like: multiple definition of `_isatty’
To start, go to Project > Properties.
Go in to C/C++ General > Paths and Symbols. Click on the Source Location tab. Click on the arrow next to /<your project>/Src to view the filter. Select Filter (empty) and click the Edit Filter… button. Add syscalls.c to the Exclusion patterns list and click OK.
Click Apply.
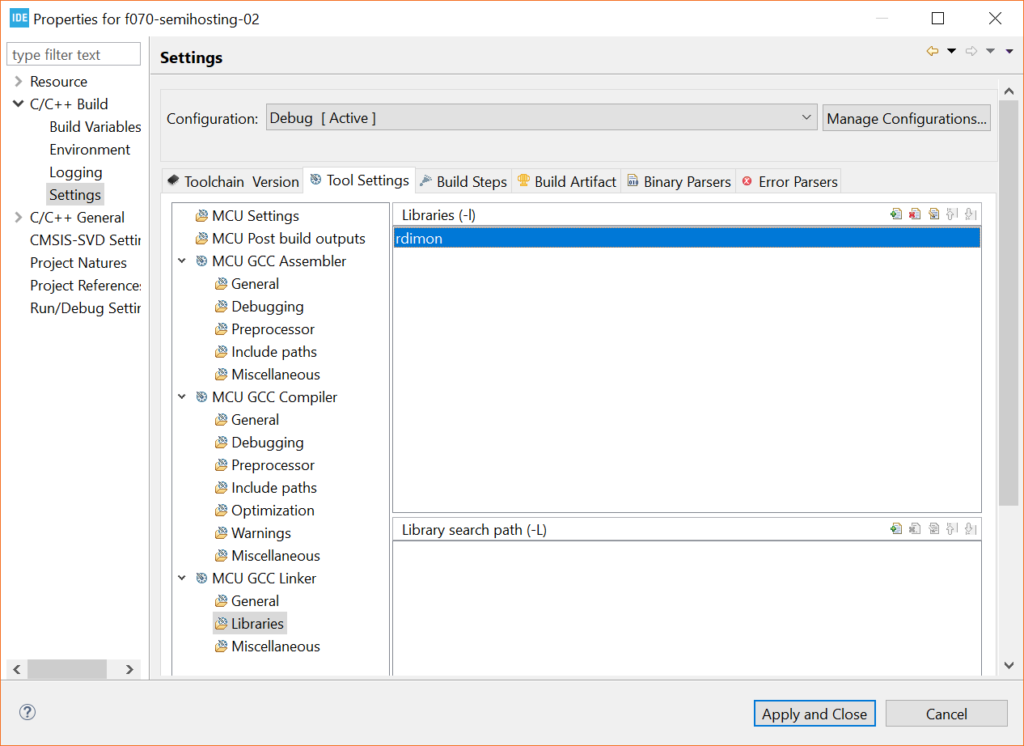
On the left-side pane, go into C/C++ Build and select the Tool Settings tab. Then, select MCU GCC Linker > Libraries. In the libraries pane, click the Add… button and enter rdimon. This enables librdimon for us to make system calls with semihosting.
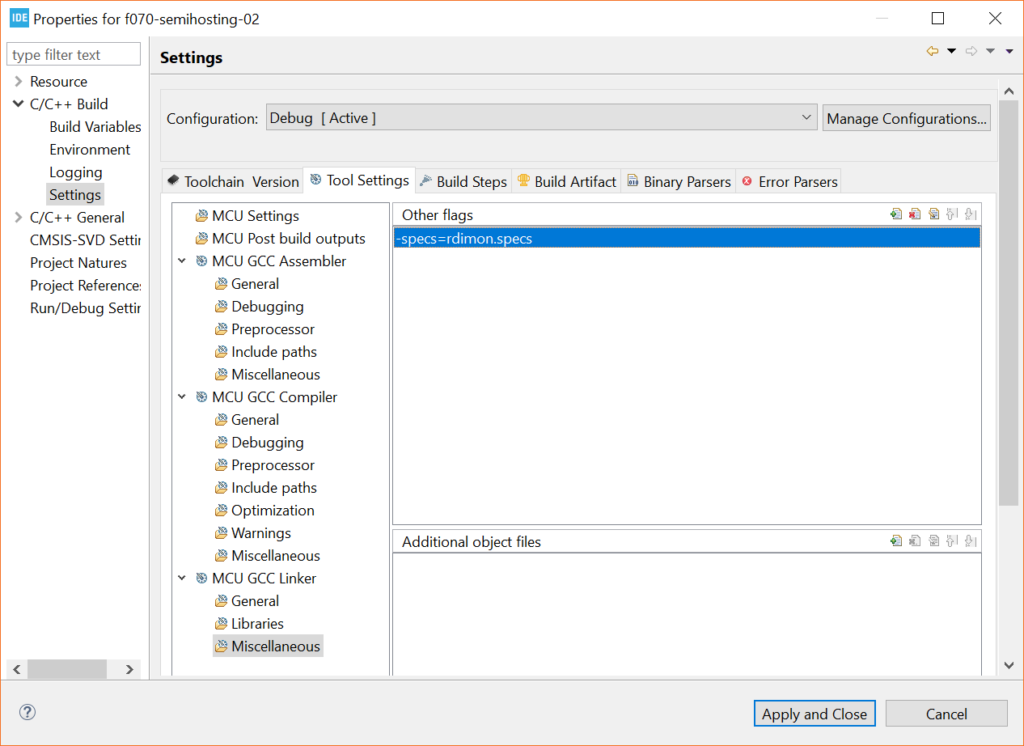
Next, click on MCU GCC Linker > Miscellaneous while still in the Tool Settings tab. Click the Add… button and enter –specs=rdimon.specs into the dialog box.
If you have used another STM32 IDE before and got semihosting to work, you probably needed to specify nano.specs and nosys.specs in the linker options. If you take a look at MCU Settings and MCU GCC Linker > General (within the Tool Settings tab), you will see that both of these have been set by default in STM32CubeIDE.
Click Apply and Close.
Add printf Code
Open Src/main.c. Above int main(void) , add the following line (I put mine in the USER CODE 0 section):
extern void initialise_monitor_handles(void);
In int main(void) (before the while(1) loop), add the following line (I put mine in the USER CODE 1 section):
initialise_monitor_handles();
This configures the semihosting system calls for us.
Finally, inside the while(1) loop, add the following:
printf("Hello, World!\n");
HAL_Delay(1000);
To summarize, here is the section of code from main.c that you need to worry about:
/* Private user code ---------------------------------------------------------*/
/* USER CODE BEGIN 0 */
extern void initialise_monitor_handles(void);
/* USER CODE END 0 */

/**
* @brief The application entry point.
* @retval int
*/
int main(void)
{
/* USER CODE BEGIN 1 */
initialise_monitor_handles();
/* USER CODE END 1 */

/* MCU Configuration--------------------------------------------------------*/

/* Reset of all peripherals, Initializes the Flash interface and the Systick. */
HAL_Init();

/* USER CODE BEGIN Init */

/* USER CODE END Init */

/* Configure the system clock */
SystemClock_Config();

/* USER CODE BEGIN SysInit */

/* USER CODE END SysInit */

/* Initialize all configured peripherals */
/* USER CODE BEGIN 2 */

/* USER CODE END 2 */

/* Infinite loop */
/* USER CODE BEGIN WHILE */
while (1)
{
/* USER CODE END WHILE */

/* USER CODE BEGIN 3 */
printf("Hello, World!\n");
HAL_Delay(1000);
}
/* USER CODE END 3 */
}
Click Project > Build Project to compile and link everything.
Set Debug Configuration
Select Run > Debug As > STM32 MCU C/C++ Application. You should get a pop-up window asking you to “edit launch configuration properties.” If you have already done this once before, you will not get the launch configuration window. To get it, click on Run > Debug Configurations and select <your project>.elf under STM32 MCU Debugging.
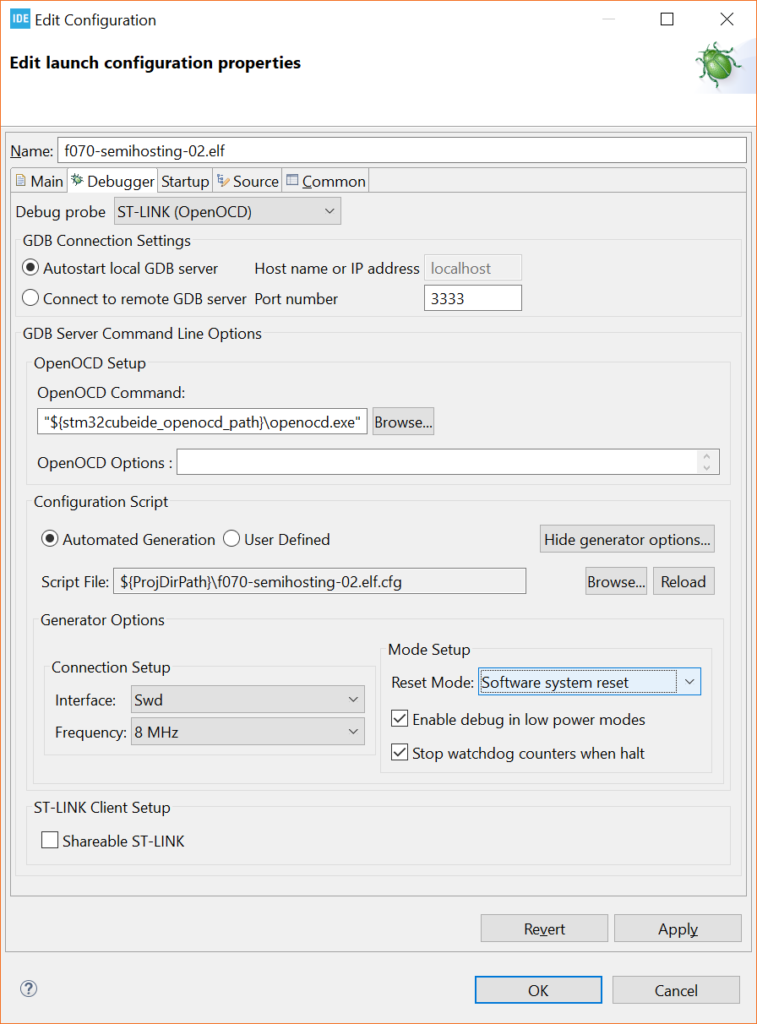
Click on the Debugger tab. Change the Debug probe to ST-LINK (OpenOCD).
If you are using an official ST-LINK, you should be good to go. However, note that RST pin of the knockoff ST-LINK boards (such as the ST-LINK/V2 I listed above) may not work. As a result, you will need to use the software reset option when GDB starts.
To enable software reset, click Show generator options… in the Debugger tab (while still in the Debug Configurations window). Under Mode Setup, change Reset Mode to Software system reset.
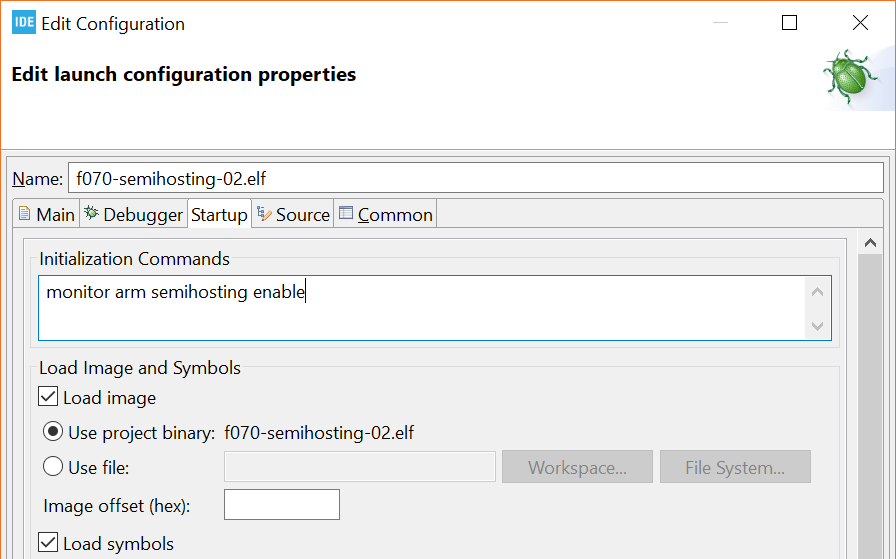
Go to the Startup tab and enter the following command: monitor arm semihosting enable
This tells the GDB session to allow for semihosting. Click OK, and switch to the debugging perspective when asked.
Run It
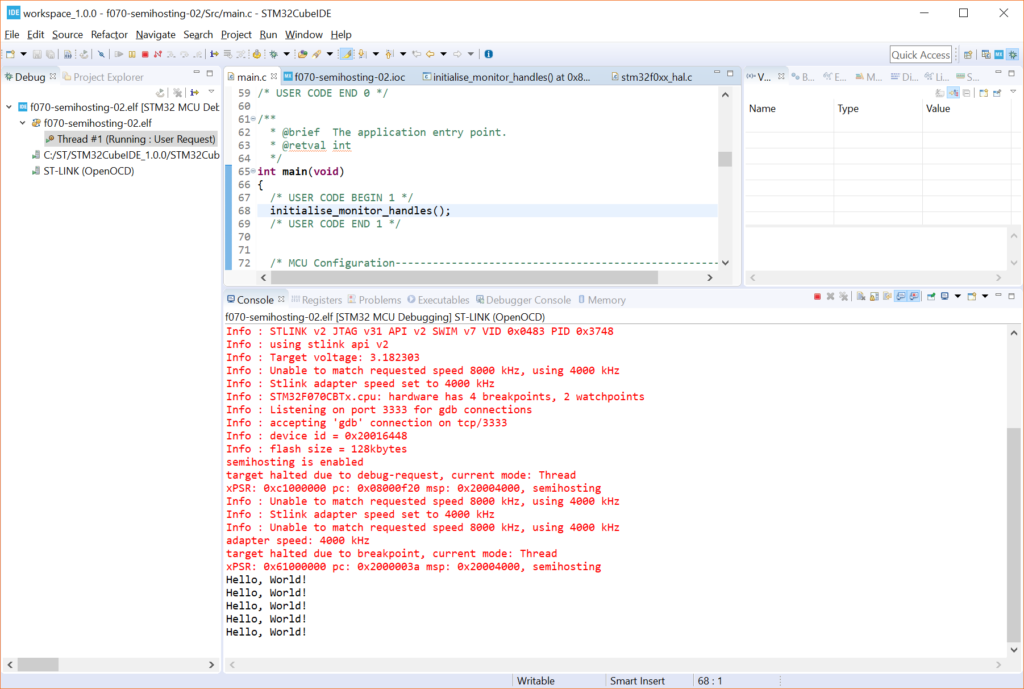
In the debugging perspective, click Run > Resume, and you should see “Hello, World!” being printed at the bottom of the console once per second.
Semihosting can help you with your debugging efforts, should you need some kind of console output. Note that other standard commands, like scanf, should work (I have not tested it yet).

